Trends
The trends page is available to all users.
Trends information is currently under development. Please let us know if there are any additions, issues, or requests regarding this module.
The trends page allows all users to view a simple summary of trending write-up systems and subsystems within the organization.
Filtering data
By aircraft
To filter trend data by aircraft tail number, select a tail number in the Aircraft field. Users can search through this list to find their desired tail number.
To clear the aircraft filter, simply de-select the tail.
By status
By default, data includes archived (cleared) write-ups. To exclude these write-ups, Toggle the With archived write-ups switch.
By date
To filter trend data by date, select your desired date range. The current year, current month, and all time ranges are provided to the user.
Users are able to select a custom date range by selecting the Custom date range. When selected, a date range picker will be displayed. Clicking the desired dates will select the start and ending dates (inclusive).
To select a single date, simply click the same date twice under Custom date range.
Tabular format
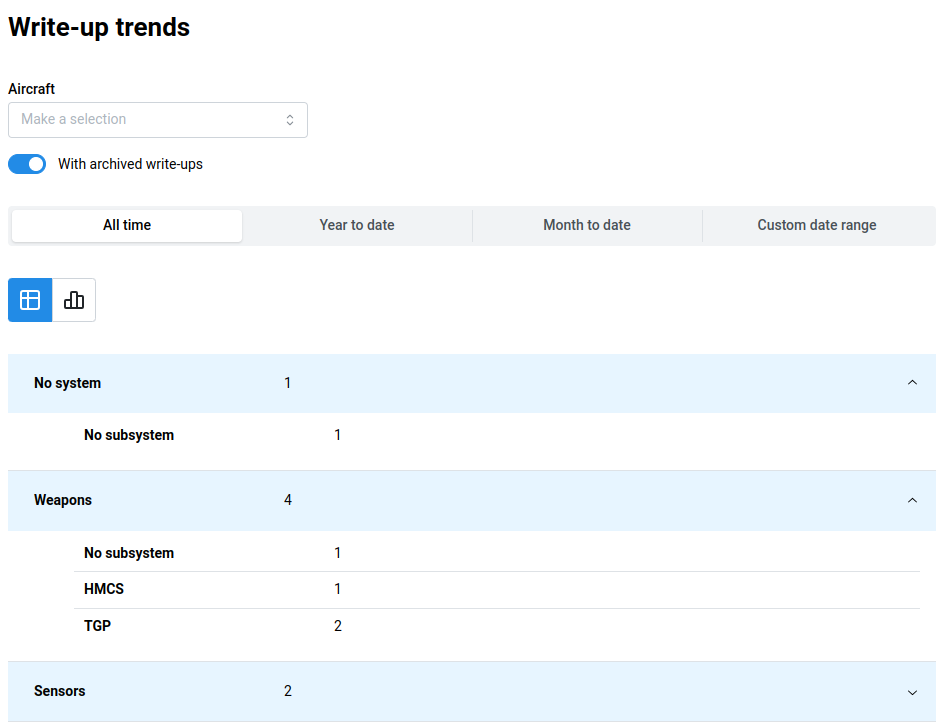
The tabular format displays systems as individual groups. Next to the system name is the total count of write-ups with the associated system.
The no system / no subsystem groups display the count of write-ups without a selected system or subsystem.
This can typically occur for write-ups that are Code 1
Clicking the system will expand the data associated with it, displaying the individual subsystems and the count of write-ups with the respective subsystem selected.
If a system or subsystem does not have any write-ups associated with it, it will not be displayed
Graphical format
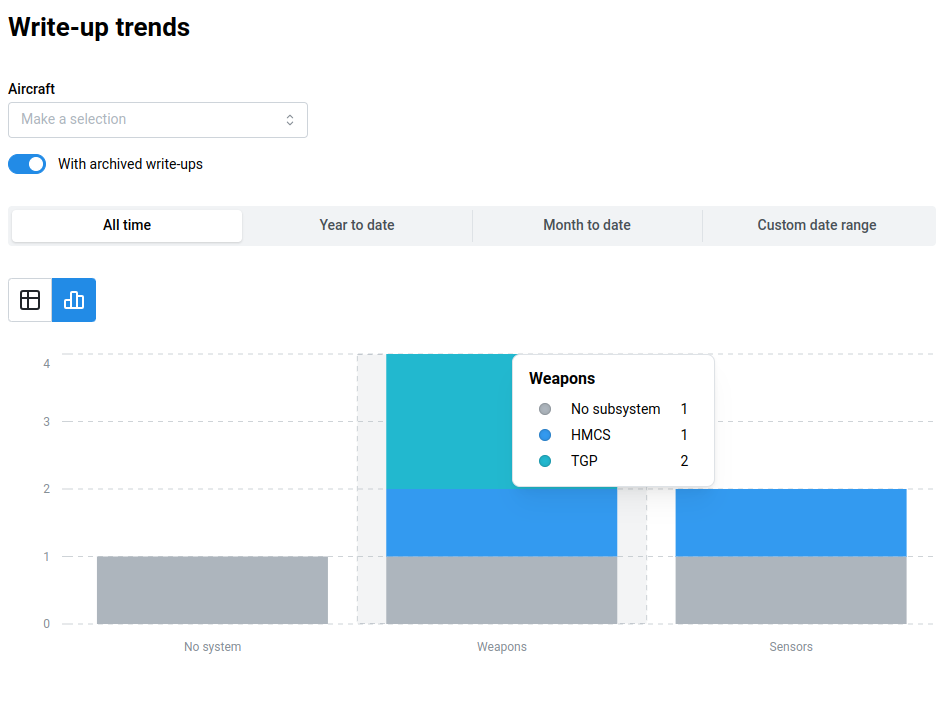
When the graphical format is selected, the write-up data with the selected filters will be displayed as a stacked bar chart.
Systems are aligned with the x-axis series of the chart while the number of write-ups for each system is aligned with the y-axis of the chart.
Individual subsystems for each system will be displayed as a different color within the total bar.
Hovering over the system will display a tooltip with a color legend for the system series as well as the count of write-ups for that subsystem.